Define the term visualization: Difference between revisions
Mr. MacKenty (talk | contribs) No edit summary |
Mr. MacKenty (talk | contribs) |
||
| Line 11: | Line 11: | ||
# http://www.bizbrain.org/coffee/ | # http://www.bizbrain.org/coffee/ | ||
# https://graphics.straitstimes.com/STI/STIMEDIA/Interactives/2018/04/marvel-cinematic-universe-whos-who-interactive/index.html | # https://graphics.straitstimes.com/STI/STIMEDIA/Interactives/2018/04/marvel-cinematic-universe-whos-who-interactive/index.html | ||
<br /> | |||
# https://pudding.cool/projects/vocabulary/ | |||
# https://interaktiv.morgenpost.de/europakarte/#4/50.57/22.50/en | |||
# https://www.economist.com/news/2019/01/10/the-big-mac-index | |||
== Types of visualizations == | == Types of visualizations == | ||
Latest revision as of 12:52, 21 January 2019

Modeling & Simulation[1]
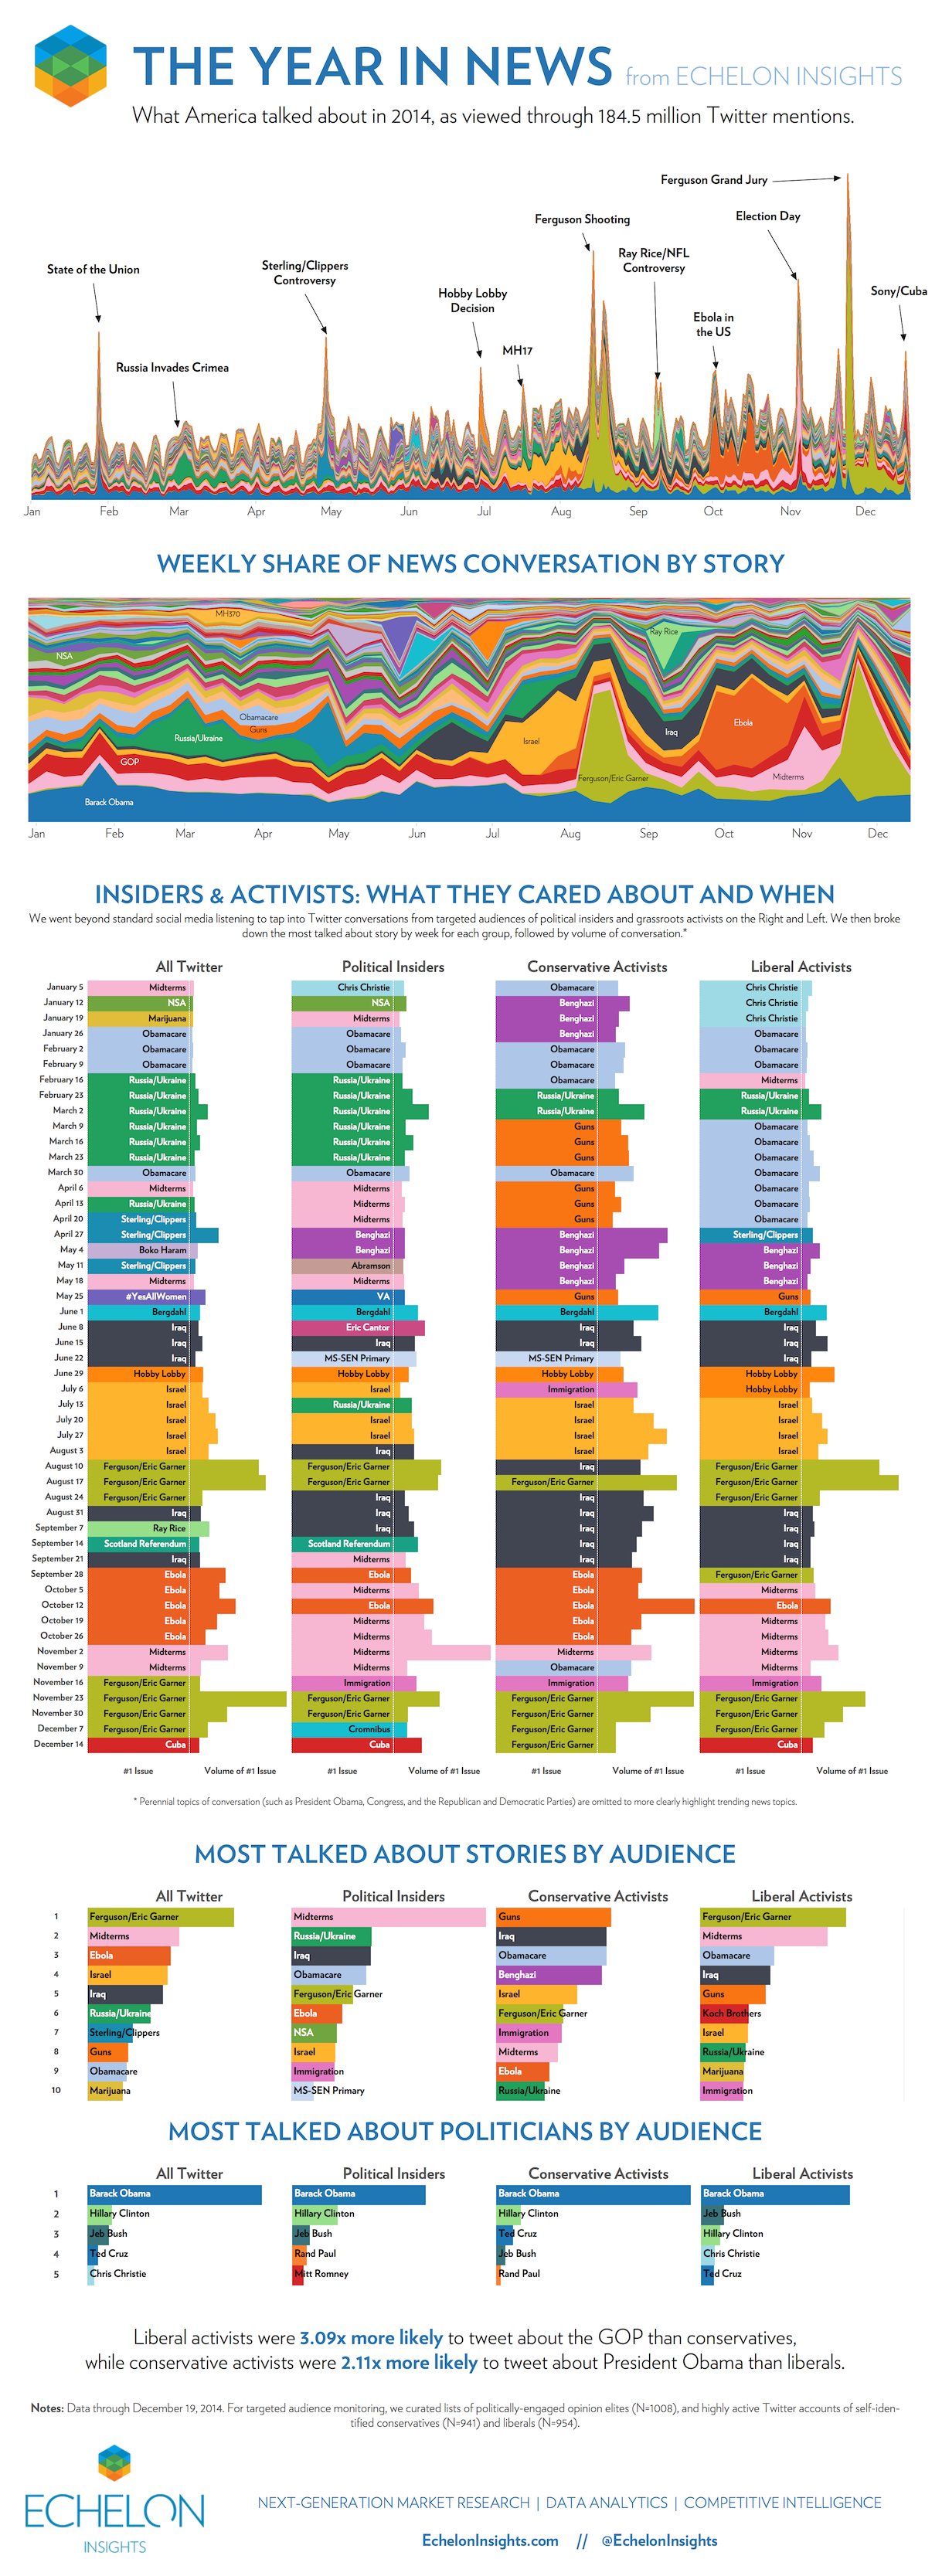
As a subject in computer science, scientific visualization is the use of interactive, sensory representations, typically visual, of abstract data to reinforce cognition, hypothesis building, and reasoning.[2]
Examples[edit]
- https://projects.newyorker.com/story/citi-bike.html
- https://www.tableau.com/learn/articles/best-beautiful-data-visualization-examples
- https://podio.com/site/creative-routines

- http://www.bizbrain.org/coffee/
- https://graphics.straitstimes.com/STI/STIMEDIA/Interactives/2018/04/marvel-cinematic-universe-whos-who-interactive/index.html
- https://pudding.cool/projects/vocabulary/
- https://interaktiv.morgenpost.de/europakarte/#4/50.57/22.50/en
- https://www.economist.com/news/2019/01/10/the-big-mac-index
Types of visualizations[edit]
Standards[edit]
- Define the term visualization.