Graph theory and connectivity of the web: Difference between revisions
Mr. MacKenty (talk | contribs) No edit summary |
Mr. MacKenty (talk | contribs) No edit summary |
||
| Line 1: | Line 1: | ||
[[file:Connection.png|right|frame|Web Science<ref>http://www.flaticon.com/</ref>]] | [[file:Connection.png|right|frame|Web Science<ref>http://www.flaticon.com/</ref>]] | ||
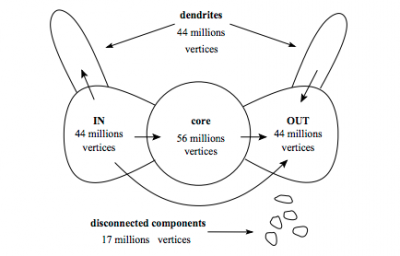
It is useful to visually map the web to better understand the structure. There are many different ways to imagine what the web might look like ([https://xkcd.com/802_large/ including this rather funny map]) but there is some academic agreement about: | |||
[[ | * bowtie structure | ||
* strongly connected core (SCC) | |||
* diameter | |||
[[File:Bowtie.png|400px]] | |||
== Do you understand this? == | == Do you understand this? == | ||
Revision as of 10:30, 22 January 2018

Web Science[1]
It is useful to visually map the web to better understand the structure. There are many different ways to imagine what the web might look like (including this rather funny map) but there is some academic agreement about:
- bowtie structure
- strongly connected core (SCC)
- diameter
Do you understand this?[edit]
Standards[edit]
These standards are used from the IB Computer Science Subject Guide[2]
- Describe the main features of the web graph such as bowtie structure, strongly connected core (SCC), diameter.
- Explain the role of graph theory in determining the connectivity of the web.
References[edit]
- ↑ http://www.flaticon.com/
- ↑ IB Diploma Programme Computer science guide (first examinations 2014). Cardiff, Wales, United Kingdom: International Baccalaureate Organization. January 2012.
